First-year depreciation often involves accelerated methods that allow for higher expense recognition upfront, maximizing initial tax benefits. Annual depreciation spreads the cost evenly or progressively over the asset's useful life, providing consistent expense allocation each year. Choosing between these approaches affects cash flow management and financial reporting accuracy.
Table of Comparison
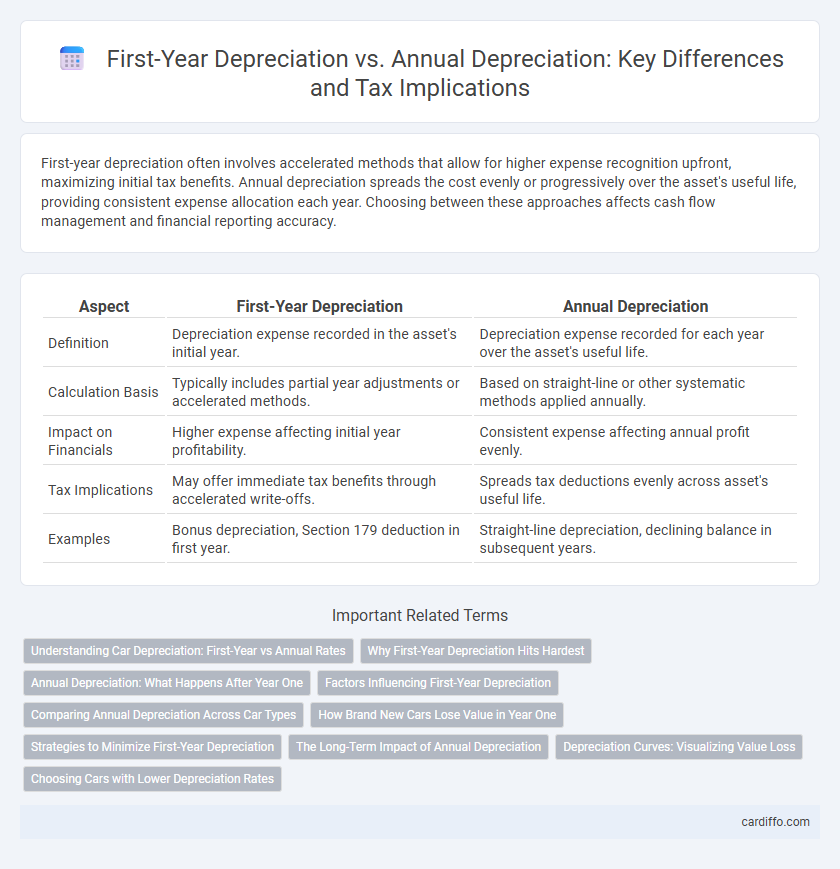
| Aspect | First-Year Depreciation | Annual Depreciation |
|---|---|---|
| Definition | Depreciation expense recorded in the asset's initial year. | Depreciation expense recorded for each year over the asset's useful life. |
| Calculation Basis | Typically includes partial year adjustments or accelerated methods. | Based on straight-line or other systematic methods applied annually. |
| Impact on Financials | Higher expense affecting initial year profitability. | Consistent expense affecting annual profit evenly. |
| Tax Implications | May offer immediate tax benefits through accelerated write-offs. | Spreads tax deductions evenly across asset's useful life. |
| Examples | Bonus depreciation, Section 179 deduction in first year. | Straight-line depreciation, declining balance in subsequent years. |
Understanding Car Depreciation: First-Year vs Annual Rates
Car depreciation is most significant in the first year, often losing 20-30% of its value due to initial usage and market factors impacting resale price. Annual depreciation rates typically slow down after the first year, averaging around 15-20% annually depending on the make, model, and market conditions. Understanding these varying depreciation rates aids buyers in evaluating long-term vehicle costs and resale value projections.
Why First-Year Depreciation Hits Hardest
First-year depreciation impacts asset value most significantly due to accelerated depreciation methods like Bonus or Section 179, which front-load expense deductions for tax benefits. These approaches result in larger write-offs during the initial year of asset acquisition, reducing taxable income more substantially than subsequent years. Annual depreciation spreads the remaining asset cost evenly or by a declining balance, making yearly deductions less aggressive compared to the substantial first-year impact.
Annual Depreciation: What Happens After Year One
Annual depreciation reflects the consistent allocation of an asset's cost over its useful life following the first year, often calculated using methods like straight-line or declining balance. After the initial year of accelerated depreciation, such as the double-declining balance method, the annual depreciation expense typically decreases, providing a more stable expense recognition. Tracking annual depreciation accurately is crucial for financial statements, tax filings, and asset management to reflect true asset value and expense patterns over time.
Factors Influencing First-Year Depreciation
First-year depreciation is significantly influenced by factors such as the asset's acquisition cost, depreciation method chosen (e.g., straight-line, double declining balance), and applicable tax regulations or incentives like Section 179 or bonus depreciation. The timing of asset purchase within the fiscal year also affects the depreciation amount, often resulting in a prorated calculation. Understanding these variables is essential for accurate asset valuation and maximizing tax benefits in the initial year of ownership.
Comparing Annual Depreciation Across Car Types
First-year depreciation typically accounts for the largest drop in a vehicle's value, often between 20% to 30%, depending on the make and model. Annual depreciation rates vary significantly across car types, with luxury vehicles experiencing sharper declines compared to economy cars, which tend to depreciate more steadily over time. SUVs and trucks usually retain value better annually due to higher demand and durability factors, impacting overall depreciation calculations.
How Brand New Cars Lose Value in Year One
Brand new cars experience the highest depreciation in the first year, typically losing 20% to 30% of their initial purchase value due to rapid market value adjustment and initial usage. This first-year depreciation significantly exceeds annual depreciation rates in subsequent years, which average around 15% per year. Understanding this steep initial value drop is crucial for buyers, sellers, and insurance valuation.
Strategies to Minimize First-Year Depreciation
To minimize first-year depreciation, businesses often use accelerated depreciation methods such as the Modified Accelerated Cost Recovery System (MACRS) to front-load deductions while planning replacements strategically to spread out asset write-offs. Opting for higher residual values and maintaining assets through preventive maintenance can also reduce the initial depreciation impact. Leveraging tax incentives and selecting assets with longer useful lives further helps in managing first-year depreciation effectively.
The Long-Term Impact of Annual Depreciation
Annual depreciation allocates an asset's cost evenly over its useful life, ensuring consistent expense recognition which supports accurate long-term financial planning and tax strategy. This method impacts cash flow by spreading deductions across multiple years, improving predictability for budgeting and investment decisions. First-year depreciation, often accelerated, can create significant initial tax savings but may lead to reduced deductions in subsequent years, affecting long-term financial stability.
Depreciation Curves: Visualizing Value Loss
First-year depreciation typically shows a steep decline in asset value, reflecting the highest loss immediately after purchase, whereas annual depreciation demonstrates a more consistent and gradual reduction over subsequent years. Depreciation curves visually illustrate these differences, with the initial drop steep and sharp, followed by smoother, linear or declining-balance slopes depending on the method used. Understanding these curves aids businesses in accurately forecasting asset value and financial planning.
Choosing Cars with Lower Depreciation Rates
First-year depreciation for cars typically ranges from 20% to 30%, significantly impacting resale value compared to steady annual depreciation rates of about 15% in subsequent years. Choosing vehicles with historically lower depreciation rates, such as Toyota, Honda, or Subaru models, can preserve value and reduce total cost of ownership over time. Analyzing depreciation curves and market demand for specific makes helps buyers select cars that retain higher resale prices after the initial year of ownership.
First-Year Depreciation vs Annual Depreciation Infographic