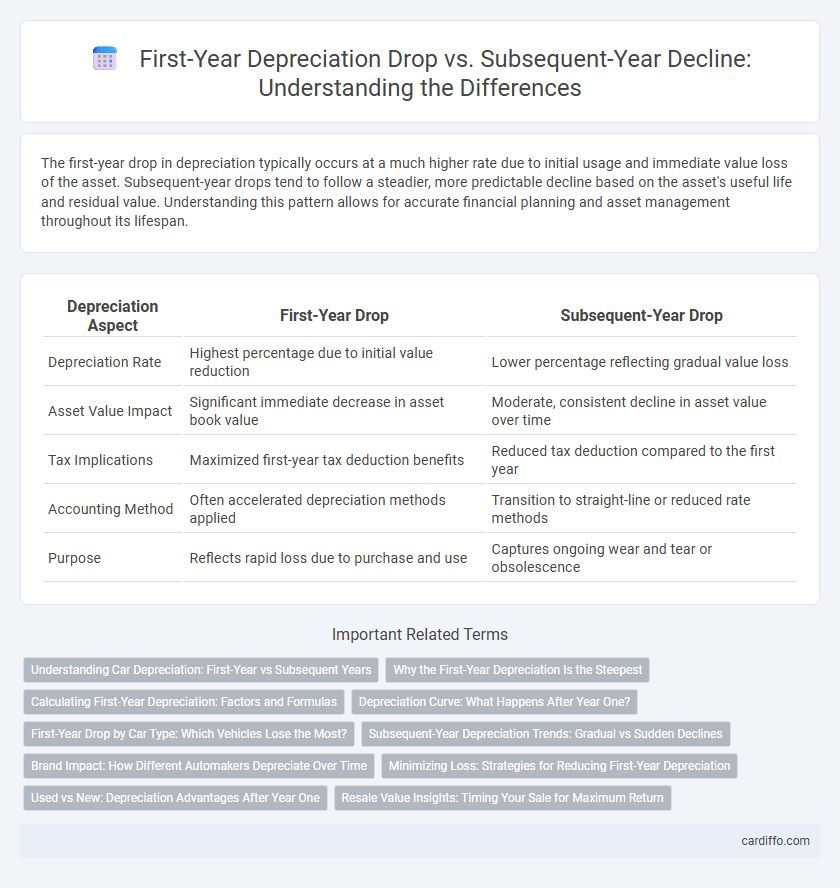
The first-year drop in depreciation typically occurs at a much higher rate due to initial usage and immediate value loss of the asset. Subsequent-year drops tend to follow a steadier, more predictable decline based on the asset's useful life and residual value. Understanding this pattern allows for accurate financial planning and asset management throughout its lifespan.
Table of Comparison
| Depreciation Aspect | First-Year Drop | Subsequent-Year Drop |
|---|---|---|
| Depreciation Rate | Highest percentage due to initial value reduction | Lower percentage reflecting gradual value loss |
| Asset Value Impact | Significant immediate decrease in asset book value | Moderate, consistent decline in asset value over time |
| Tax Implications | Maximized first-year tax deduction benefits | Reduced tax deduction compared to the first year |
| Accounting Method | Often accelerated depreciation methods applied | Transition to straight-line or reduced rate methods |
| Purpose | Reflects rapid loss due to purchase and use | Captures ongoing wear and tear or obsolescence |
Understanding Car Depreciation: First-Year vs Subsequent Years
Car depreciation is steepest in the first year, often dropping 20-30% due to initial value loss and market adjustments. Subsequent years see a slower depreciation rate of about 15% annually, influenced by mileage, condition, and demand. Understanding this pattern helps buyers anticipate resale value and optimize vehicle lifecycle costs.
Why the First-Year Depreciation Is the Steepest
First-year depreciation is the steepest due to the immediate loss of vehicle value from initial usage, showroom markup reduction, and rapid technological obsolescence. This accelerated drop reflects the initial adjustment from new to used condition, capturing significant depreciation components like dealer incentives and market demand shifts. Subsequent-year depreciation rates decrease as the asset transitions into a stabilized used value phase with lower relative value declines.
Calculating First-Year Depreciation: Factors and Formulas
Calculating first-year depreciation involves applying specific methods such as the Modified Accelerated Cost Recovery System (MACRS) or straight-line formula, considering the asset's purchase price, useful life, and applicable depreciation rate. Key factors include the asset's initial cost basis, convention (half-year or mid-quarter), and any applicable bonus depreciation or Section 179 deductions. Accurate first-year depreciation calculations directly impact tax savings and the asset's book value for subsequent years.
Depreciation Curve: What Happens After Year One?
The depreciation curve typically shows a steep decline in asset value during the first year, reflecting rapid initial loss due to factors like initial wear and obsolescence. Subsequent years exhibit a more gradual depreciation rate as the asset's residual value stabilizes and usage patterns normalize. This shift from a sharp first-year drop to a flattened curve in following years highlights the importance of understanding asset lifecycle and allocating expenses accurately for financial reporting and tax purposes.
First-Year Drop by Car Type: Which Vehicles Lose the Most?
First-year depreciation varies significantly by car type, with luxury vehicles and electric cars experiencing the steepest initial value drops, often exceeding 30%. SUVs and trucks typically retain value better, losing around 20% to 25% in the first year. Understanding first-year drop patterns helps buyers gauge long-term investment risks and resale value across different vehicle categories.
Subsequent-Year Depreciation Trends: Gradual vs Sudden Declines
Subsequent-year depreciation trends typically exhibit gradual declines, reflecting steady asset value reduction over time instead of the steep drop seen in the first year. This pattern aligns with accounting practices like the straight-line method, where depreciation expense remains consistent annually after the initial higher first-year write-off. Understanding these gradual declines aids in accurately forecasting asset book value and managing long-term financial planning.
Brand Impact: How Different Automakers Depreciate Over Time
Luxury automakers such as Mercedes-Benz and BMW typically experience a steep first-year drop in vehicle value, often losing 30% to 40% due to initial market saturation and high showroom pricing. In contrast, brands like Toyota and Honda show a more gradual depreciation curve with smaller annual drops following the first year, reflecting stronger brand loyalty and perceived reliability. This variation in depreciation patterns greatly influences resale values and buyer perception across different segments in the automotive industry.
Minimizing Loss: Strategies for Reducing First-Year Depreciation
Minimizing first-year depreciation involves selecting vehicles with high residual values and utilizing depreciation-friendly financing or leasing options. Employing maintenance practices and avoiding excessive mileage in the initial year helps preserve asset value. Strategic purchasing decisions and timely resale can significantly reduce the financial impact of the steep first-year drop compared to subsequent-year depreciation declines.
Used vs New: Depreciation Advantages After Year One
New vehicles experience a steep first-year drop, often losing 20-30% of their value immediately, while used cars depreciate more gradually after year one, typically around 10-15% annually. This slower depreciation rate in subsequent years offers used car buyers a financial advantage, preserving more vehicle value over time. Understanding the difference in depreciation patterns between new and used cars can guide buyers toward better long-term investment decisions.
Resale Value Insights: Timing Your Sale for Maximum Return
Resale value declines steeply in the first year, often losing 20-30% of the vehicle's initial cost due to immediate depreciation factors. Subsequent-year drops tend to moderate, averaging 10-15% annually as the vehicle ages and accumulates mileage. Timing your sale after the initial steep depreciation but before accelerated wear and tear can maximize your return and preserve resale value.
First-Year Drop vs Subsequent-Year Drop Infographic