Year-on-year depreciation measures the gradual loss in value of an asset over multiple years, providing a consistent assessment of its declining worth. First-year depreciation captures the significant initial drop in value immediately after purchase, often higher due to accelerated depreciation methods. Understanding the difference helps in accurate financial planning and tax reporting for asset management.
Table of Comparison
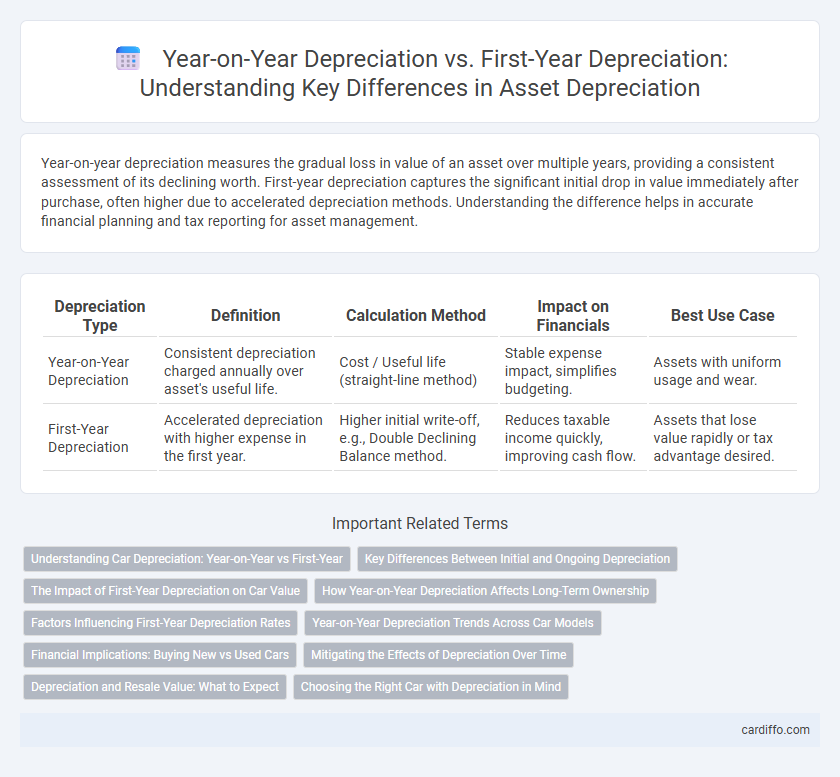
| Depreciation Type | Definition | Calculation Method | Impact on Financials | Best Use Case |
|---|---|---|---|---|
| Year-on-Year Depreciation | Consistent depreciation charged annually over asset's useful life. | Cost / Useful life (straight-line method) | Stable expense impact, simplifies budgeting. | Assets with uniform usage and wear. |
| First-Year Depreciation | Accelerated depreciation with higher expense in the first year. | Higher initial write-off, e.g., Double Declining Balance method. | Reduces taxable income quickly, improving cash flow. | Assets that lose value rapidly or tax advantage desired. |
Understanding Car Depreciation: Year-on-Year vs First-Year
Year-on-year depreciation measures the decline in a car's value annually, reflecting gradual wear and market conditions, while first-year depreciation captures the significant initial drop immediately after purchase, often ranging between 20% to 30%. Understanding the distinction helps car buyers and sellers evaluate true vehicle worth over time and make informed financial decisions. First-year depreciation typically accounts for the largest loss, with subsequent yearly declines occurring at a more steady, predictable rate.
Key Differences Between Initial and Ongoing Depreciation
Year-on-year depreciation reflects the consistent reduction in an asset's value spread evenly over its useful life, while first-year depreciation often includes accelerated methods such as the double-declining balance or bonus depreciation, resulting in a higher expense upfront. The initial depreciation impacts cash flow and tax benefits significantly in the acquisition year, contrasting with the stable, predictable expense pattern of subsequent years. Understanding these key differences aids in optimizing financial planning and tax strategy for asset management.
The Impact of First-Year Depreciation on Car Value
First-year depreciation typically accounts for the largest reduction in a car's value, often ranging from 20% to 30% within the initial 12 months of ownership. This steep decline significantly affects resale value compared to year-on-year depreciation, which tends to be more gradual at 10% to 15% annually after the first year. Understanding the impact of first-year depreciation is crucial for buyers and sellers aiming to accurately estimate a vehicle's long-term worth.
How Year-on-Year Depreciation Affects Long-Term Ownership
Year-on-year depreciation provides a consistent annual reduction in asset value, enabling more accurate long-term financial planning and tax forecasting. This method spreads depreciation evenly, preserving cash flow stability over the asset's useful life. By contrast, first-year depreciation often results in a large initial write-off but may lead to higher taxable income in subsequent years, impacting overall ownership costs.
Factors Influencing First-Year Depreciation Rates
First-year depreciation rates are influenced by asset type, acquisition cost, and applicable tax regulations, which determine how much value an asset loses initially. Accelerated depreciation methods, such as double-declining balance, increase first-year depreciation compared to straight-line methods used in year-on-year calculations. Economic factors like market demand and technological obsolescence also impact asset valuation and thus affect depreciation rates in the first year.
Year-on-Year Depreciation Trends Across Car Models
Year-on-year depreciation trends reveal that luxury and electric car models tend to retain value better than economy models, with depreciation rates averaging 10-15% annually compared to 20-30% in lower-tier vehicles. First-year depreciation often accounts for the steepest loss, ranging from 20-25%, but subsequent yearly declines stabilize, highlighting the importance of long-term value retention metrics. Analyzing these trends across various brands and models helps buyers predict resale value and optimize total cost of ownership.
Financial Implications: Buying New vs Used Cars
Year-on-year depreciation measures the consistent loss in a vehicle's value each year, impacting long-term financial planning for buyers. First-year depreciation typically accounts for the most significant value drop, often 20-30%, affecting the initial investment the moment a new car is driven off the lot. Choosing a used car avoids this steep initial depreciation, offering better financial value retention over time despite potentially higher maintenance costs.
Mitigating the Effects of Depreciation Over Time
Year-on-year depreciation spreads the asset's value reduction evenly across its useful life, allowing for predictable expense management and smoother financial planning. First-year depreciation often involves accelerated methods, such as bonus depreciation or Section 179 deductions, leading to significant initial expense recognition but reduced depreciation in subsequent years. Mitigating depreciation effects over time requires balancing immediate tax benefits with long-term asset value reporting, optimizing cash flow while maintaining accurate financial statements.
Depreciation and Resale Value: What to Expect
Year-on-year depreciation reflects a gradual decline in an asset's value, typically resulting in a more predictable resale value over time. First-year depreciation is often the steepest, drastically reducing the asset's book value and influencing its immediate resale price. Understanding these depreciation patterns helps set realistic expectations for the asset's future resale value and financial planning.
Choosing the Right Car with Depreciation in Mind
Year-on-year depreciation measures the gradual loss in a car's value over multiple years, typically averaging around 15-20% annually, which offers a clearer picture of long-term ownership costs. First-year depreciation is significantly higher, often around 20-30%, meaning the largest drop in value occurs within the initial 12 months after purchase. Choosing a car with lower first-year depreciation, such as models from brands like Toyota or Honda, ensures better resale value and more efficient cost management over time.
Year-on-Year Depreciation vs First-Year Depreciation Infographic