First-year depreciation typically allows for a higher deduction due to accelerated methods like bonus depreciation or Section 179 expensing, reducing taxable income significantly in the purchase year. Subsequent-year depreciation applies a slower, systematic approach such as the Modified Accelerated Cost Recovery System (MACRS), spreading the cost over the asset's useful life. This distinction impacts cash flow and tax planning strategies by front-loading expenses initially and allocating lower deductions in later years.
Table of Comparison
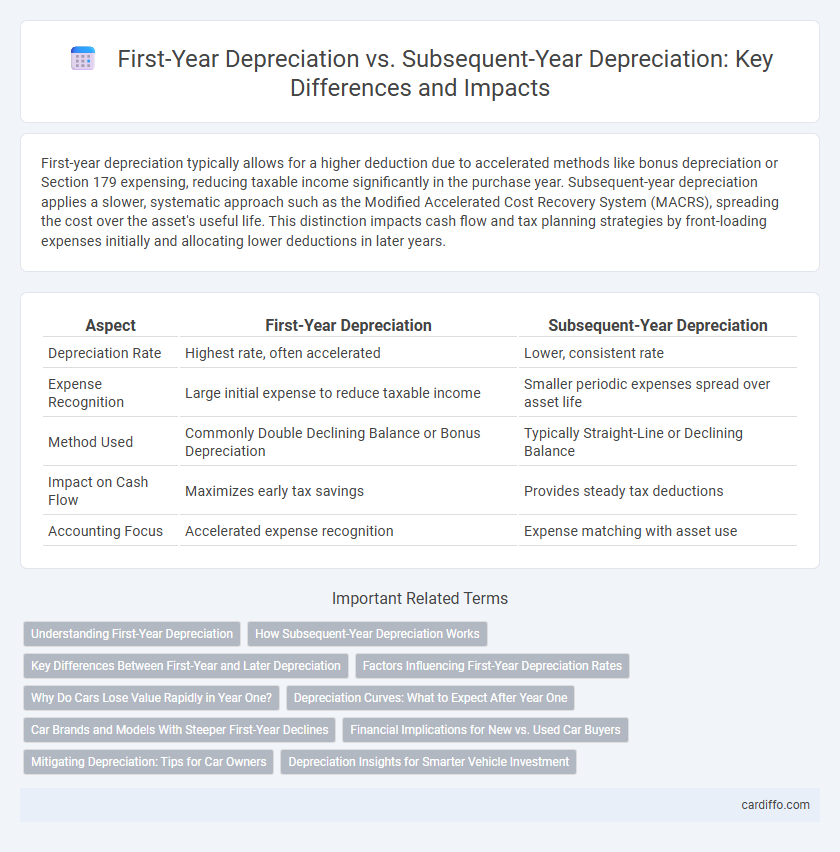
| Aspect | First-Year Depreciation | Subsequent-Year Depreciation |
|---|---|---|
| Depreciation Rate | Highest rate, often accelerated | Lower, consistent rate |
| Expense Recognition | Large initial expense to reduce taxable income | Smaller periodic expenses spread over asset life |
| Method Used | Commonly Double Declining Balance or Bonus Depreciation | Typically Straight-Line or Declining Balance |
| Impact on Cash Flow | Maximizes early tax savings | Provides steady tax deductions |
| Accounting Focus | Accelerated expense recognition | Expense matching with asset use |
Understanding First-Year Depreciation
First-year depreciation typically allows businesses to write off a larger portion of an asset's cost due to accelerated depreciation methods like Section 179 or bonus depreciation, maximizing tax benefits upfront. This initial depreciation is calculated based on the asset's purchase price and specific IRS guidelines, which often enable a substantial deduction in the acquisition year. Understanding these rules is essential for accurate financial planning and tax strategy, as first-year depreciation impacts both asset valuation and taxable income.
How Subsequent-Year Depreciation Works
Subsequent-year depreciation calculates asset value reduction using methods like straight-line or declining balance, spreading the expense evenly or accelerating it over the asset's useful life. The asset's book value decreases annually based on the chosen depreciation schedule, impacting profit and tax liabilities consistently after the initial year. Accurate tracking of subsequent-year depreciation ensures precise financial reporting and compliance with accounting standards.
Key Differences Between First-Year and Later Depreciation
First-year depreciation often uses accelerated methods such as bonus depreciation or Section 179 to maximize deductions upfront, while subsequent-year depreciation typically follows a standard straight-line or declining balance method. The initial depreciation amount is substantially higher in the first year due to these incentives, reducing taxable income significantly compared to later years. Subsequent-year depreciation results in smaller, consistent deductions spread over the asset's useful life, impacting financial statements and tax planning differently.
Factors Influencing First-Year Depreciation Rates
First-year depreciation rates are primarily influenced by asset type, purchase cost, and applicable tax regulations such as the Modified Accelerated Cost Recovery System (MACRS) in the United States. Accelerated depreciation methods often allow higher expense recognition in the initial year, impacted by factors like asset class life and bonus depreciation eligibility. Other determinants include the acquisition date, business usage percentage, and industry-specific depreciation policies.
Why Do Cars Lose Value Rapidly in Year One?
Cars lose value rapidly in the first year due to steep initial depreciation caused by factors such as selling price adjustments, immediate wear and tear, and shifting consumer perceptions of the vehicle's newness. Manufacturer incentives and dealer discounts can also create a significant drop as the vehicle transitions from new to used status. Subsequent-year depreciation rates slow down as the car's market value stabilizes and mileage accumulates more steadily.
Depreciation Curves: What to Expect After Year One
First-year depreciation typically follows an accelerated curve, with a larger expense recognized due to initial asset usage and tax incentives. Subsequent-year depreciation shifts to a more gradual, straight-line or declining-balance pattern, reflecting reduced wear and economic benefit over time. Depreciation curves after year one illustrate this tapering effect, impacting financial statements and asset valuation forecasts significantly.
Car Brands and Models With Steeper First-Year Declines
Luxury car brands such as BMW, Mercedes-Benz, and Audi typically experience steeper first-year depreciation compared to economy brands like Toyota and Honda. Models like the BMW 5 Series and Mercedes-Benz E-Class can lose up to 30% of their value in the first year, while subsequent-year depreciation rates generally stabilize around 10-15% annually. Understanding these patterns aids buyers in predicting long-term costs and resale values for different car brands and models.
Financial Implications for New vs. Used Car Buyers
First-year depreciation on new cars often exceeds 20%, significantly reducing resale value and impacting loan-to-value ratios for buyers financing a new vehicle. Subsequent-year depreciation rates typically slow to around 15% annually, making used cars a more cost-effective option with less immediate loss in value. Financially, new car buyers face steeper asset value declines affecting insurance premiums and tax deductions, whereas used car buyers benefit from more stable depreciation curves and lower overall ownership costs.
Mitigating Depreciation: Tips for Car Owners
Car owners can mitigate first-year depreciation, which typically accounts for 20-30% of a vehicle's value, by opting for certified pre-owned cars or delaying new car purchases. Subsequent-year depreciation slows to about 10-15% annually, so maintaining the vehicle with regular servicing and preserving its condition can retain higher resale value. Strategic decisions like choosing cars with strong resale values and avoiding excessive mileage also reduce overall depreciation impact.
Depreciation Insights for Smarter Vehicle Investment
First-year depreciation on vehicles typically accounts for the largest drop in value, often exceeding 20%, making it crucial for investors to consider timing when purchasing. Subsequent-year depreciation rates tend to stabilize, averaging around 15% annually, which influences long-term asset valuation and resale strategies. Understanding these depreciation patterns enables smarter vehicle investments by optimizing purchase price and maximizing future returns.
First-Year Depreciation vs Subsequent-Year Depreciation Infographic