Real Driving Emissions (RDE) measure pollutants directly from vehicles during everyday trips, providing more accurate data compared to Laboratory Emissions tested under controlled, artificial conditions. RDE addresses discrepancies by capturing factors like traffic, altitude, and weather that laboratory tests may overlook. Emphasizing RDE helps ensure stricter compliance with environmental standards and promotes cleaner air quality in real-world settings.
Table of Comparison
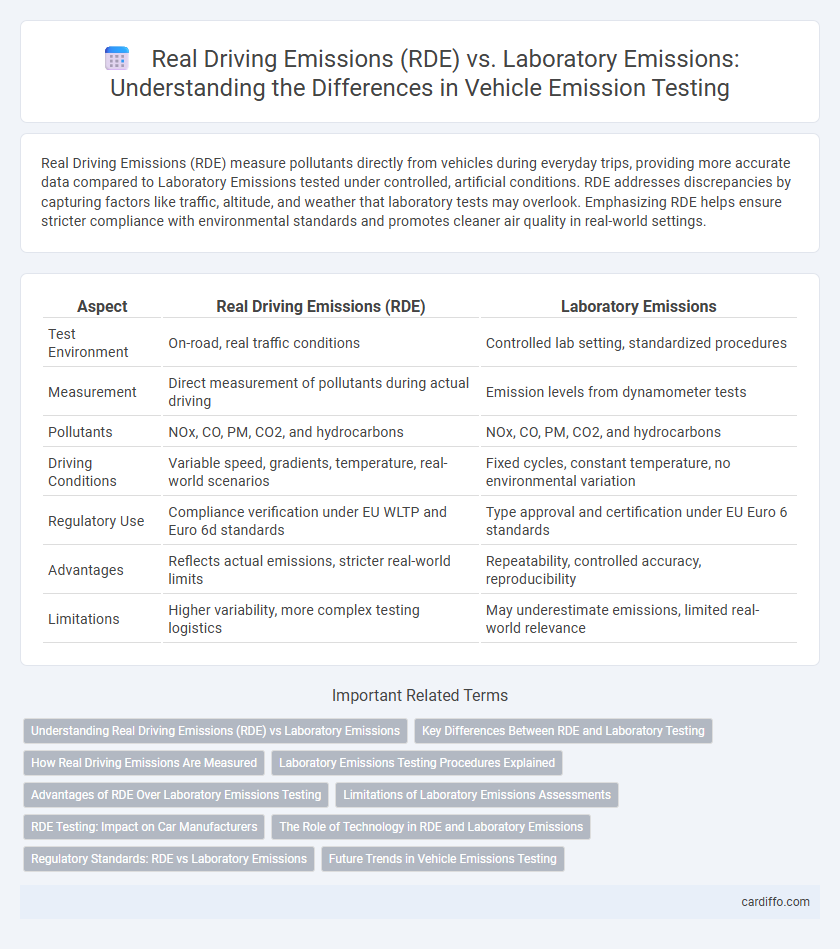
| Aspect | Real Driving Emissions (RDE) | Laboratory Emissions |
|---|---|---|
| Test Environment | On-road, real traffic conditions | Controlled lab setting, standardized procedures |
| Measurement | Direct measurement of pollutants during actual driving | Emission levels from dynamometer tests |
| Pollutants | NOx, CO, PM, CO2, and hydrocarbons | NOx, CO, PM, CO2, and hydrocarbons |
| Driving Conditions | Variable speed, gradients, temperature, real-world scenarios | Fixed cycles, constant temperature, no environmental variation |
| Regulatory Use | Compliance verification under EU WLTP and Euro 6d standards | Type approval and certification under EU Euro 6 standards |
| Advantages | Reflects actual emissions, stricter real-world limits | Repeatability, controlled accuracy, reproducibility |
| Limitations | Higher variability, more complex testing logistics | May underestimate emissions, limited real-world relevance |
Understanding Real Driving Emissions (RDE) vs Laboratory Emissions
Real Driving Emissions (RDE) testing measures pollutants such as NOx and particulate matter during actual on-road vehicle operation, providing a more accurate representation of real-world environmental impact compared to Laboratory emissions tests conducted under controlled conditions. Laboratory emissions testing, including the Worldwide Harmonized Light Vehicles Test Procedure (WLTP), often underestimates emissions due to standardized cycles that do not fully capture dynamic driving behaviors and varying environmental factors. Understanding the discrepancies between RDE and laboratory emissions is critical for developing regulations that better reflect true vehicle performance and for advancing emission reduction technologies.
Key Differences Between RDE and Laboratory Testing
Real Driving Emissions (RDE) testing measures pollutant output under actual road conditions, capturing variable factors such as traffic, weather, and driving behavior, unlike Laboratory Emissions testing which relies on controlled, standardized cycles. Laboratory tests often underestimate emissions due to their fixed test patterns and absence of real-world influences, leading to discrepancies in nitrogen oxides (NOx) and particulate matter (PM) levels compared to RDE results. RDE provides a more accurate and comprehensive assessment of vehicle emissions, ensuring compliance with modern regulatory limits like Euro 6d-TEMP and World Harmonized Light Vehicles Test Procedure (WLTP).
How Real Driving Emissions Are Measured
Real Driving Emissions (RDE) are measured using Portable Emissions Measurement Systems (PEMS) that collect exhaust gases directly from vehicles during everyday driving on diverse routes and conditions. This on-road testing captures pollutants such as NOx, CO2, and particulate matter under real-world environmental factors, contrasting with laboratory emissions measured under controlled, standardized cycles on chassis dynamometers. RDE testing provides a more accurate representation of vehicle emissions, reflecting actual usage scenarios and driving behaviors.
Laboratory Emissions Testing Procedures Explained
Laboratory emissions testing procedures involve measuring vehicle pollutants under controlled conditions using standardized equipment like chassis dynamometers to simulate driving scenarios. These tests focus on regulated emissions such as CO2, NOx, and particulate matter, following protocols set by authorities like the WLTP (Worldwide Harmonized Light Vehicles Test Procedure) to ensure consistency and comparability. Laboratory tests provide a baseline for emissions certification but may not fully capture the variability of real driving conditions reflected in Real Driving Emissions (RDE) testing.
Advantages of RDE Over Laboratory Emissions Testing
Real Driving Emissions (RDE) testing offers a more accurate representation of vehicle pollutant output by measuring emissions under dynamic, real-world driving conditions rather than controlled laboratory settings. RDE captures a wide range of variables such as traffic patterns, road gradients, and ambient temperatures, resulting in a comprehensive assessment of nitrogen oxides (NOx), particulate matter (PM), and carbon monoxide (CO) emissions. This approach enhances regulatory effectiveness and ensures vehicles meet emissions standards under everyday driving scenarios, improving air quality and public health protection.
Limitations of Laboratory Emissions Assessments
Laboratory emissions assessments often fail to capture the variability of real driving conditions, leading to discrepancies between measured and actual pollutant levels. Controlled test cycles lack factors such as road gradients, traffic congestion, and ambient temperature variations that significantly influence Real Driving Emissions (RDE). This limitation results in underestimating nitrogen oxides (NOx) and particulate matter emissions, undermining the accuracy of regulatory compliance and environmental impact evaluations.
RDE Testing: Impact on Car Manufacturers
Real Driving Emissions (RDE) testing measures pollutants like NOx and particulate matter under actual road conditions, revealing discrepancies often underestimated in laboratory settings. Car manufacturers face increased regulatory pressure to meet stricter RDE limits, driving innovation in engine technology and exhaust after-treatment systems. This shift from laboratory to on-road emissions assessment impacts design strategies, compliance costs, and market competitiveness within the automotive industry.
The Role of Technology in RDE and Laboratory Emissions
Advanced sensor technologies and real-time data processing play a critical role in accurately measuring Real Driving Emissions (RDE), capturing a wide range of environmental and driving conditions that laboratory tests cannot replicate. Laboratory emissions rely on controlled environments and standardized cycles, often underestimating pollutant levels compared to on-road RDE measurements. Innovations in portable emissions measurement systems (PEMS) and hybrid testing methodologies enhance the precision of emissions data, driving regulatory compliance and the development of cleaner automotive technologies.
Regulatory Standards: RDE vs Laboratory Emissions
Regulatory standards increasingly mandate Real Driving Emissions (RDE) testing alongside traditional laboratory emissions to capture accurate pollutant levels under actual driving conditions. Laboratory emissions testing often underestimates nitrogen oxides (NOx) and particulate matter due to controlled, idealized environments, whereas RDE measures tailpipe emissions in real-world scenarios, reflecting variations in traffic, temperature, and driving styles. Compliance with Euro 6d-TEMP and Euro 7 standards requires manufacturers to ensure vehicles meet emissions limits both in lab tests and during on-road RDE assessments, enhancing environmental protection and public health.
Future Trends in Vehicle Emissions Testing
Future trends in vehicle emissions testing emphasize the integration of Real Driving Emissions (RDE) measurements with traditional laboratory testing to ensure more accurate representation of pollutant outputs under actual driving conditions. Advances in portable emissions measurement systems (PEMS) enable continuous monitoring of nitrogen oxides (NOx), particulate matter (PM), and carbon dioxide (CO2) directly on the road, reflecting real-world scenarios that laboratory cycles may underestimate. Regulatory frameworks are evolving to incorporate stricter RDE standards, facilitating the development of cleaner vehicle technologies and promoting sustainable transportation policies worldwide.
Real driving emissions (RDE) vs Laboratory emissions Infographic